Intersection over Union (IoU) and Generalized IoU are already discussed. Other few importants are discussed here.
Top-1 and Top-5 Accuracy
In multi-class object detection problems, we get probability of each class for the predicted bounding-boxes.
Top-1 Accuracy checks if the top class (one with the highest probability) is same as the target label. Top-5 Accuracy checks if the target label is within the top-5 predicted label/class (ones with highest probabilities)
Precision and Recall
In object detection models, we are finding ground-truth bounding-boxes, where each resulting bounding-boxes must be first classified as :
- True Positive (TP) : A correct detection of ground-truth bounding-box
- True Negative (TN) : A correct detection of non-existing spaces
- False Positive (FP) : An incorrect detection of non-existing spaces. non-existing spaces labeled as bounding-box.
- False Negative (FN) : An undetected ground-truth bounding-box. bounding-box labeled as non-existing object
Precision is the ability of a model to identify only relevant objects, whereas Recall is the ability to find all relevant cases (all ground-truth bounding-boxes). If we have a dataset with $G$ ground-truths and a model that outputs \(N\) detections, of which \(S\) are correct \((S \le G)\), then Precision(P) and Recall(R) can be written as:
\[\text{Precision (P)} = \frac{\sum_{n=1}^S TP_{n}}{\sum_{n=1}^S TP_{n} + \sum_{n=1}^{N-S} FP_{n}}\] \[\text{Recall(R)} = \frac{\sum_{n=1}^S TP_{n}}{\sum_{n=1}^S TP_{n} + \sum_{n=1}^{G-S} FN_{n}}\]ROC and AUC
An ROC curve or Reciever Operating Characteristics Curve is a graph showing the performance of a classification model at all classification thresholds. This curve plots two parameters : TPR and FPR.
True Positive Rate (TPR) \(\equiv \text{Recall} = \frac{TP}{TP + FN}\),whereas False Positive Rate (FPR) \(= \frac{FP}{FP + TN}\).
With ROC, lowering the classification threshold classifies more items as positive, and thereby increasing both FP and TP. A typical ROC is shown below :
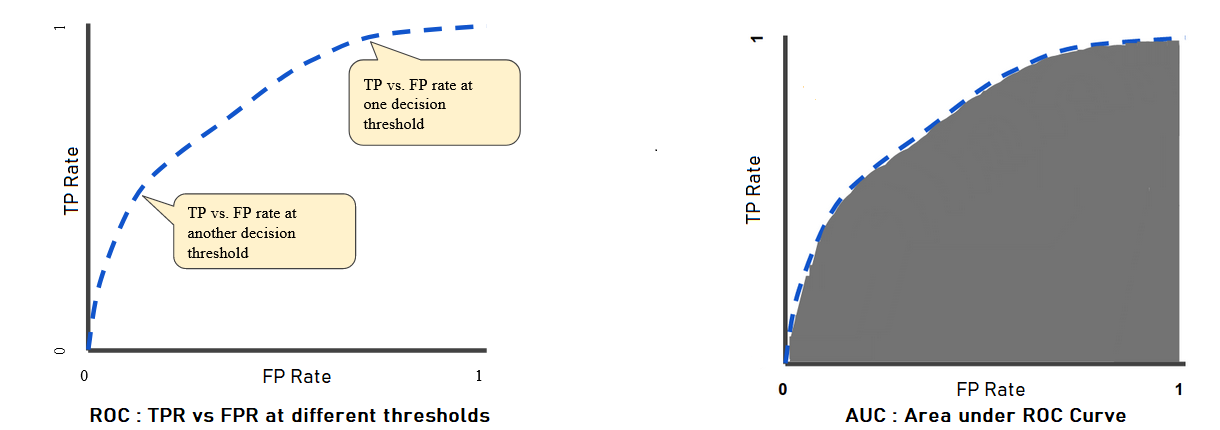
AUC stands for Area under the ROC Curve. It measures the entire 2D area underneath ROC Courve from $(0,0)$ to $(1,1)$. AUC ranges in value from \(0\) to \(1\). If a model is \(100\%\) correct, it has AUC of \(1.0\), and if \(100\%\) incorrect, then AUC of \(0.0\)
Two key things here :
- AUC is scale-invariant. It measures how well predictions are ranked, and not their absolute values.
- AUC is classification-threshold-invariant. It measures the quality of the models’ prediction irrespective of what classfication threshold is chosen.
Average Precision
We know that, a detection is considered positive only when it has IoU higher than certain threshold, $\tau$. Otherwise negative. Now, eq(1) and eq(2) can be written as :
\(P(\tau) = \frac{TP(\tau)}{TP(\tau) + FP(\tau)}\) and \(R(\tau) = \frac{TP(\tau)}{TP(\tau) + FN(\tau)}\)
In the above presented equations, both \(TP(\tau)\) and \(FP(\tau)\) are decreasing function of \(\tau\), whereas \(FN(\tau)\) is increasing function.
Therefore, we can say that :
\(R(\tau)\) is a decreasing function of \(\tau\), wheras nothing can be said about \(P(\tau)\) Consequently, AUC under \(P(\tau) × R(\tau)\) exhibit zig-zag pattern.
Average Precision is area under \(\text{Precision} × \text{Recall}\), which has pre-processed to remove zig-zag pattern and monotonic. It is similar to AUC and ranges between $0$ and $1$.
To compute AP, first start collecting pairs of Precision and Recall, with different confidence values \(\tau(k)\) where \(k = 1,2, \cdots k\). These Precision can be written as \(P(\tau(k))\) and Recall as \(R(\tau(k))\).
Next, interpolation is applied to turn precision $\times$ recall into monotonic. Interpolation function, \(P_{ip}(R)\), where \(R\) is a real value contained in the interval \([0,1]\) is defined as :
\[P_{ip}(R) = max_{k \lvert R(\tau(k)) \ge R} \left[{P(\tau(k))}\right]\]Now, Average Precision (AP) can be calculated by sampling \(P_{ip}(R)\) at the \(N\) reference recall values \(R_{r}\) as :
\[AP = \sum_{k=0}^k (R_{r}(k) - R_{r}(k+1))P_{ip}(R_{r}(k))\]Mean Average Precision (mAP)
If we have many classes in the dataset, then mean average precision is just simply the average AP over all classes
\[mAP = \frac{1}{C} \sum_{i=1}^C AP_{i}\]where \(AP_{i}\) is the AP value for the \(i^{th}\) class and \(C\) is the total number of classes.